

A version of this post first appeared on TKer.co
Stocks closed higher last week with the S&P 500 rallying 1.8%. The index is now up 11.5% year to date, up 19.7% from its October 12 closing low of 3,577.03, and down 10.7% from its January 3, 2022 record closing high of 4,796.56.
Almost every day, we get monthly updates on a handful of economic metrics. These metrics cover every aspect of the economy, and some even get updated weekly!
Markets are prone to react to developments signaled by this high-frequency data. But should we really be so sensitive to any single report?
Consider what’s been going on with the monthly report on job openings.
On Tuesday, we learned job openings unexpectedly increased to 10.1 million in April. MarketWatch ran with the headline: “Job openings rise to 3-month high, keeping pressure on the Fed.” This is in sharp contrast to the March print of 9.6 million.
One month, things look very bad in the labor market. The next month, things look pretty good.
So, which is it?
Ever since job openings peaked at 12.0 million in March of last year, the metric has been trending lower. And one or two months’ data hasn’t change that.
The truth is that economic data does not move in smooth, straight lines. Even as job openings have trended lower over the past 13 months, the metric experienced mini spikes in July, September, November, and December.
undefined

As you can see in the chart above, longer-term trends in job openings are riddled with short-term ups and downs. In the upward trends, the short-term downs rarely signaled a turn. And in the more recent downward trend in openings, the occasional spikes proved temporary.
Maybe it’s the case that April marks the beginning of a longer-term upswing in job openings. But the point is that history says the signal from one month’s move is just not reliable.
When in doubt, zoom out 🔭
The BLS’s May employment report released on Friday also came with all sorts of confusion.
According to the BLS’s survey of establishments, employers added an impressive 339,000 payrolls in May. However, the BLS’s survey of households suggested the number of people employed fell, causing the unemployment rate to rise to 3.7%.
“The ambiguity of the report make it difficult to parse,” BofA economists wrote.
“Companies are reporting a jobs surge in May, yet households are telling us employment plunged,” ING economists wrote. “Who to believe?”
Unless you’re employing a short-term trading strategy or you’re maintaining an economic model that’s so refined every incremental update matters, then it’s probably not necessary to lose your mind over one month’s data.
“When you’re lost, it’s best to stay where you are,” Nick Bunker, economic research director at Indeed Hiring Lab, wrote on Friday. “Most other data shows a labor market with high levels of demand for workers. Hopefully, the concerning signs in this report are one-month aberrations. But we can’t know that for sure.”
None of this is to suggest that you should ignore the monthly data.
More: May jobs report shocks economists: ‘The strangest employment report for some time’
To make sense of it, it may help to — as Barry Ritholtz would say — change your perspective. A phrase you’ll sometimes hear in markets is: “When in doubt, zoom out.”
You’ll notice a few things when you zoom out of the employment stats.
First, the 339,000 payrolls added in May extends a trend of consecutive monthly job gains that started in January 2021. It’s confirmation that the labor market remains hot.
undefined

Second, total payroll employment reached a record 156.1 million, which is 3.7 million payrolls higher than the pre-pandemic high set in February 2020. Employers added 1.6 million jobs in 2023 alone.
The 339,000 payrolls added in May reflects 0.2% growth in total employment from the prior month. In other words, in the long run, one month’s gains or losses is just a rounding error.
undefined

Third, while the unemployment rate may have ticked up to 3.7% from 3.4% in April, it still remains depressed by historical standards and it remains at a levels associated with economic expansions. You can barely see the April move in the chart below.
undefined

While we’re on the subject of zooming out, the 10.1 million job openings in April, while down from its 2022 high, remains well above prepandemic levels. This excess level of job openings is one of the most obvious and intuitive reflections of robust demand for labor.
Taken together, the zoomed out data continue to reflect a labor market that, while hot, is showing signs of some cooling.
Furthermore, the strength of the labor market is one of at least eight major market narratives that hasn’t change much in a while when you take zoomed out perspectives.
Occasionally, there’ll be systemic shocks that’ll be significant enough to have an unequivocal impact on the course of trends in the economy and the markets. The credit crunch in the fall of 2008 and the rapid spread of the coronavirus in the spring of 2020 are good examples of developments where the associated shifts in data were worth taking seriously immediately.
But most of the time, small hard-to-explain swings in the data just reflect expected short-term noise in what are long-term trends.
Reviewing the macro crosscurrents 🔀
There were a few notable data points and macroeconomic developments from last week to consider:
👆 The labor market remains strong. Last week came with the May employment report, which we discussed above. There was other labor market data released, which we’ll address below.
💼 Jobs openings rise. The April Job Openings & Labor Turnover Survey (via Notes) confirmed that the labor market, while cooling, continues to be hot. Job openings rose to 10.1 million in April, up from 9.7 million in March.
undefined

During the period, there were 5.7 million unemployed people — meaning there were 1.79 job openings per unemployed person. This continues to be one of the most obvious signs of excess demand for labor.
undefined

Employers laid off 1.6 million people in April. While challenging for all those affected, this figure represents just 1.0% of total employment. This latter metric is below pre-pandemic levels.
undefined

Hiring activity continues to be much higher than layoff activity. During the month, employers hired 6.2 million people.
undefined

Here’s Indeed’s Nick Bunker on the JOLTS data: “If you look past the unexpected rise in job openings, today’s JOLTS report contains a bevy of data showing a resilient yet moderating labor market — confirming the months-long slowing trend. Openings are still elevated, but workers are becoming less likely to quit their old jobs and take new ones. Additionally, layoffs remain low, reversing their spike in March. In other words, the demand for workers is still strong and the labor market is largely continuing to chug along nicely as it finds a more sustainable balance between workers, job seekers, and employers.”
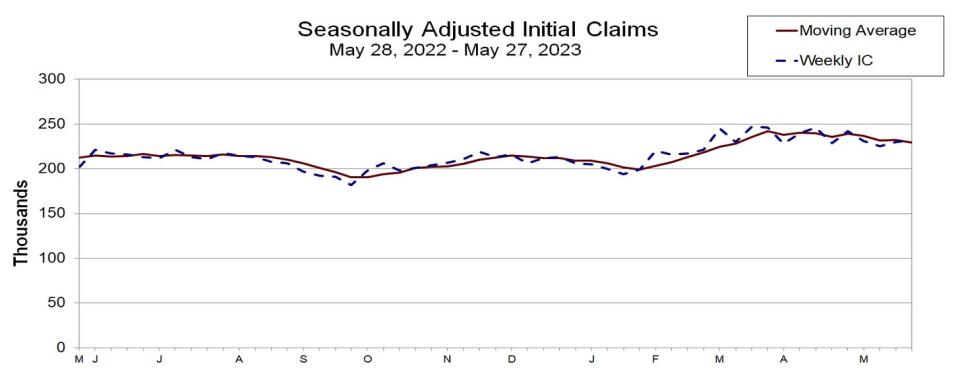
💼 Unemployment claims tick up. Initial claims for unemployment benefits climbed to 232,000 during the week ending May 27, up from 230,000 the week prior. While this is up from the September low of 182,000, it continues to trend at levels associated with economic growth.
undefined
🔀 Job-to-job moves cool. From BofA: “More recently, we saw a downshift in the [job-to-job] rate, indicating fewer people are moving between jobs. This started in the fourth quarter of 2022 and appears to be continuing. While the current j2j rate is well off the post-pandemic high, it is not back to 2019, pre-pandemic levels.”
undefined

Pay is also cooling for these folks. From BofA: “With signs that j2j moves are moderating, we also find the pay raise that job movers are getting is declining… Pre-pandemic, it appears job changers were receiving around a 10% rise. Then, when the great resignation was in full swing this appears to have risen to 20%. But as of April 2023, pay raises moderated to 13%.”
undefined

📈 Small businesses plan to hire. From the NFIB’s May Small Business Jobs Report: “Owners’ plans to fill open positions remain elevated, with a seasonally adjusted net 19 percent planning to create new jobs in the next three months, up 2 points from April but 13 points below its record high reading of 32 reached in August 2021. Hiring plans are clearly trending down, but the descent has been gradual, leaving plans still historically strong in the face of a weakening economy but in a more historically normal range.”
undefined

👍 Consumer confidence slips. From The Conference Board (via Notes): “Consumer confidence declined in May as consumers’ view of current conditions became somewhat less upbeat while their expectations remained gloomy… Their assessment of current employment conditions saw the most significant deterioration, with the proportion of consumers reporting jobs are ‘plentiful’ falling 4 ppts from 47.5 percent in April to 43.5 percent in May. Consumers also became more downbeat about future business conditions, weighing on the expectations index. However, expectations for jobs and incomes over the next six months held relatively steady. While consumer confidence has fallen across all age and income categories over the past three months, May’s decline reflects a particularly notable worsening in the outlook among consumers over 55 years of age.”
undefined

👎 Labor market confidence worsens. From The Conference Board: “Consumers’ appraisal of the labor market deteriorated. 43.5% of consumers said jobs were ‘plentiful,’ down from 47.5%. 12.5% of consumers said jobs were ‘hard to get,’ up from 10.6% last month.”

From Renaissance Macro’s Neil Dutta on the Conference Board’s report: “The main reason for optimism on the U.S. economy is that inflation, especially prices for commodities, is easing more rapidly than the labor market. As a result, real incomes will expand, supporting consumption. We saw this in [Tuesday’s] Conference Board survey. Even though the Labor Market Differential eased, net income expectations rose because inflation expectations are down.?
🏠 Home prices tick up. According to the S&P CoreLogic Case-Shiller index, home prices rose 0.7% month-over-month in March. From SPDJI’s Craig Lazzara: “Two months of increasing prices do not a definitive recovery make, but March’s results suggest that the decline in home prices that began in June 2022 may have come to an end. That said, the challenges posed by current mortgage rates and the continuing possibility of economic weakness are likely to remain a headwind for housing prices for at least the next several months.”
undefined

🤨 Survey says manufacturing is cooling. The ISM’s Manufacturing PMI (via Notes) ticked down to 46.9 in may from 47.1 in April. A reading below 50 signals contraction, which suggests manufacturing activity has been in contraction for seven consecutive months.
undefined

While most of the subcomponents of the ISM Manufacturing index deteriorated, it’s worth noting that employment expanded at an increasing rate.
undefined

🧱 Construction spending rises. Construction spending rose 1.2% to an annual rate of $1.91 trillion in April.
undefined

💳 Card spending soft but stable. From Bank of America: “Total card spending per [household] fell 0.4% y/y in the week ending May 27, according to BAC aggregated credit and debit card data. Several categories improved on a y/y basis in the last week, including lodging, entertainment and home improvement. Smoothing recent distortions for Easter and Mother’s Day, card spending growth has been soft but stable.”

From JPMorgan Chase: “As of 27 May 2023, our Chase Consumer Card spending data (unadjusted) was 0.8% above the same day last year. Based on the Chase Consumer Card data through 27 May 2023, our estimate of the US Census May control measure of retail sales m/m is 0.28%.”
undefined

🏛️ Debt ceiling drama comes to an end for now. On Saturday, President Biden signed the Fiscal Responsibility Act of 2023, the bill to suspend the debt ceiling. Long story short, financial disaster has been averted.
Putting it all together 🤔
Despite recent banking tumult, we continue to get evidence that we could see a bullish “Goldilocks” soft landing scenario where inflation cools to manageable levels without the economy having to sink into recession.
The Federal Reserve recently adopted a less hawkish tone, acknowledging on February 1 that “for the first time that the disinflationary process has started.” And on May 3, the Fed signaled that the end of interest rate hikes may be here.
In any case, inflation still has to come down more before the Fed is comfortable with price levels. So we should expect the central bank to keep monetary policy tight, which means we should be prepared for tight financial conditions (e.g. higher interest rates, tighter lending standards, and lower stock valuations) to linger.
All of this means the market beatings may continue for the time being, and the risk the economy sinks into a recession will be relatively elevated.
At the same time, it’s important to remember that while recession risks are elevated, consumers are coming from a very strong financial position. Unemployed people are getting jobs. Those with jobs are getting raises. And many still have excess savings to tap into. Indeed, strong spending data confirms this financial resilience. So it’s too early to sound the alarm from a consumption perspective.
At this point, any downturn is unlikely to turn into economic calamity given that the financial health of consumers and businesses remains very strong.
And as always, long-term investors should remember that recessions and bear markets are just part of the deal when you enter the stock market with the aim of generating long-term returns. While markets have had a pretty rough couple of years, the long-run outlook for stocks remains positive.
A version of this post first appeared on TKer.co